


Status of Current Loads
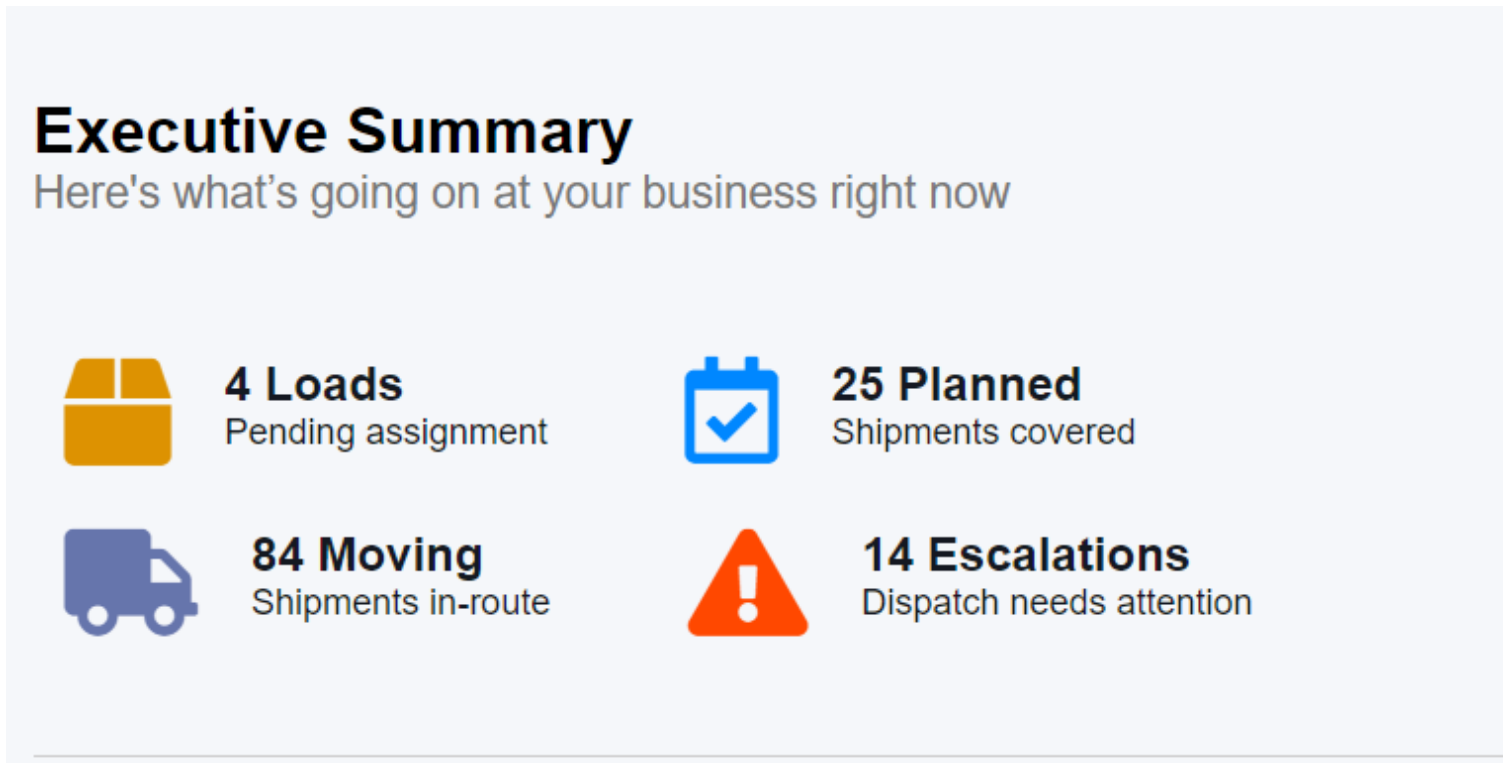
The first widgets show how many loads in your system have not yet been delivered. Click any of these stats to open the Freight Operations Dashboard.
- Pending Assignment: Available loads (Available Loads section on freight ops).
- Planned: Planned loads (Planned Loads section).
- Moving: In-transit shipments (Dispatched Loads section).
- Escalations: In-transit loads with an escalated issue that need attention.
Load Revenue Graph
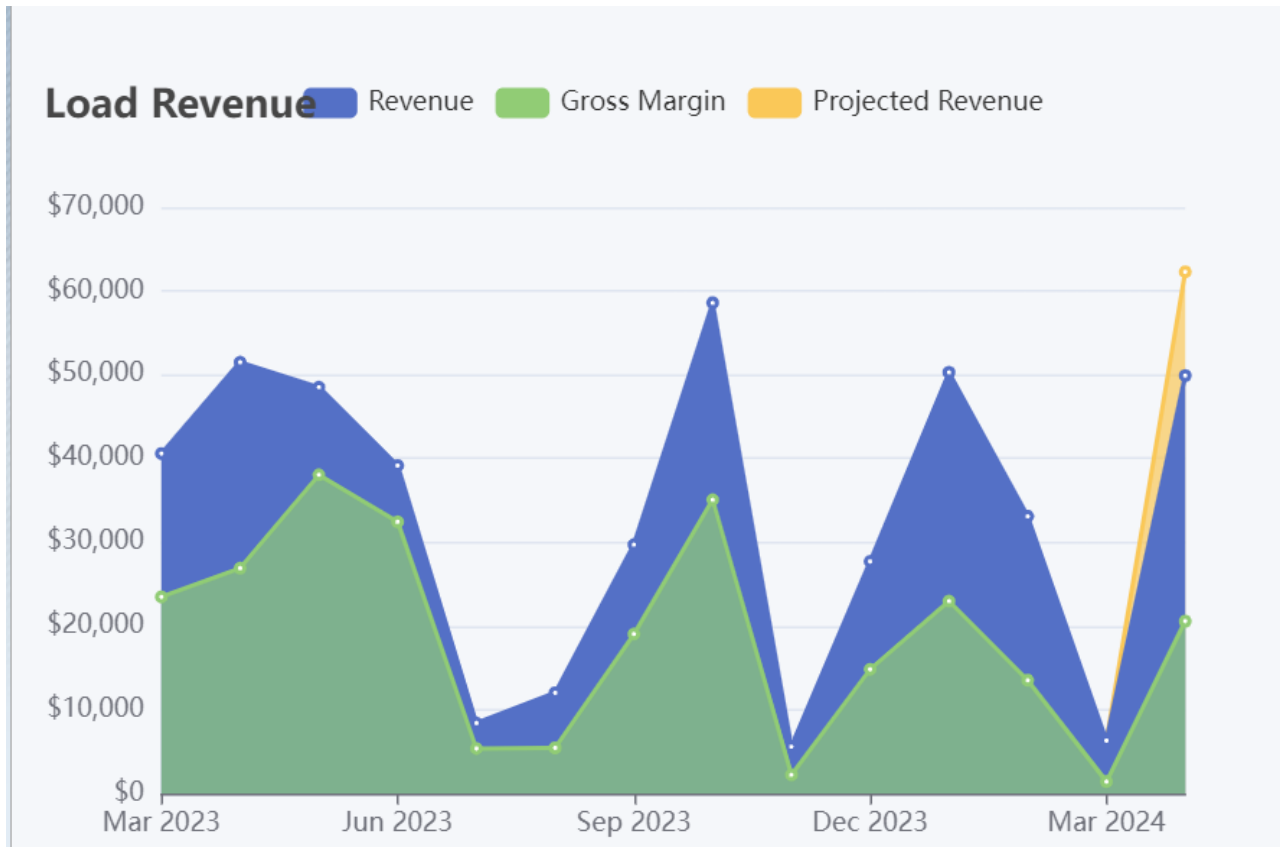
The Load Revenue chart shows revenue, gross margin, and projected revenue on a year-over-year timeline. Hover a month to see that period's figures.
- Revenue: Total amount billed.
- Gross Margin: Total billed minus total paid out.
- Projected Revenue: Uses the last 90 days of load trends against the current month. After the 20th of the month, the projection also includes available loads scheduled to pick up before month-end.
Load Count
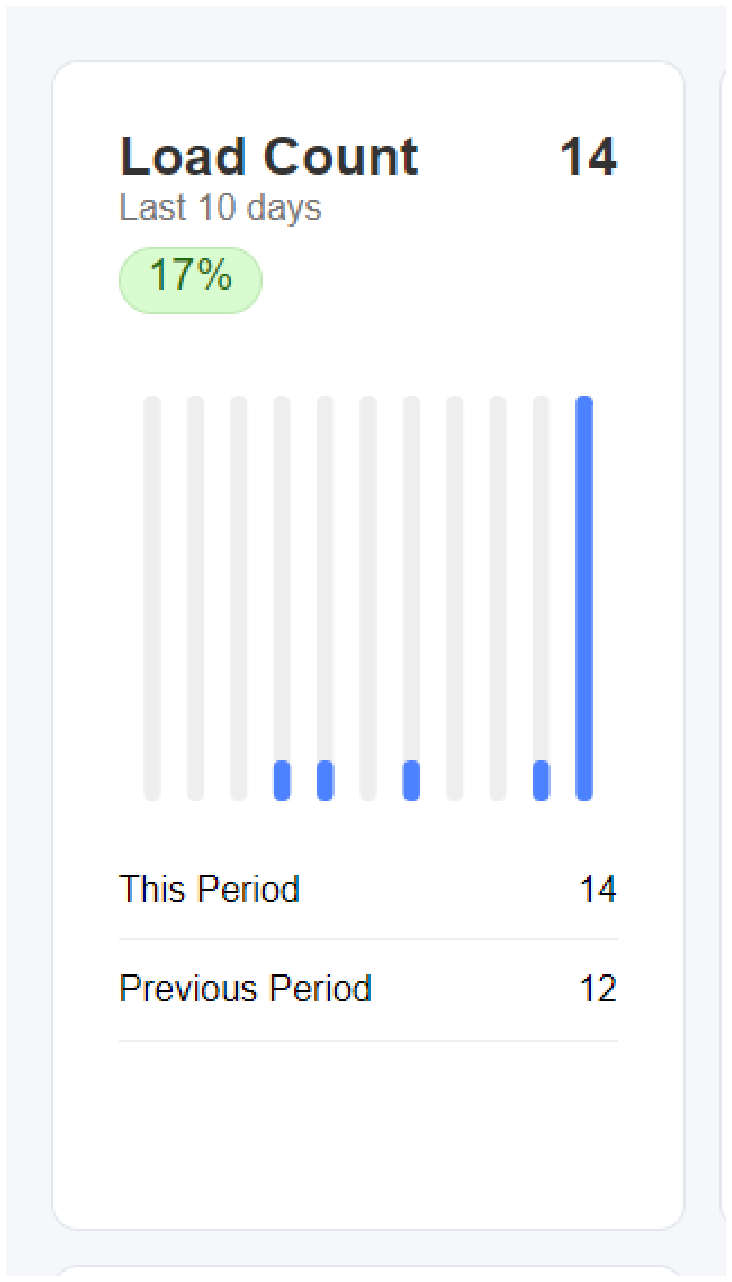
Load Count shows how many loads were planned, dispatched, or delivered over the last 10 days. Available and canceled loads are excluded. Hover a blue bar to see the date and count.
The widget also compares the previous 10-day period and can show the change as a percentage. In the example below, volume is up 2 loads (17%) versus the prior 10 days.
Gross Margin
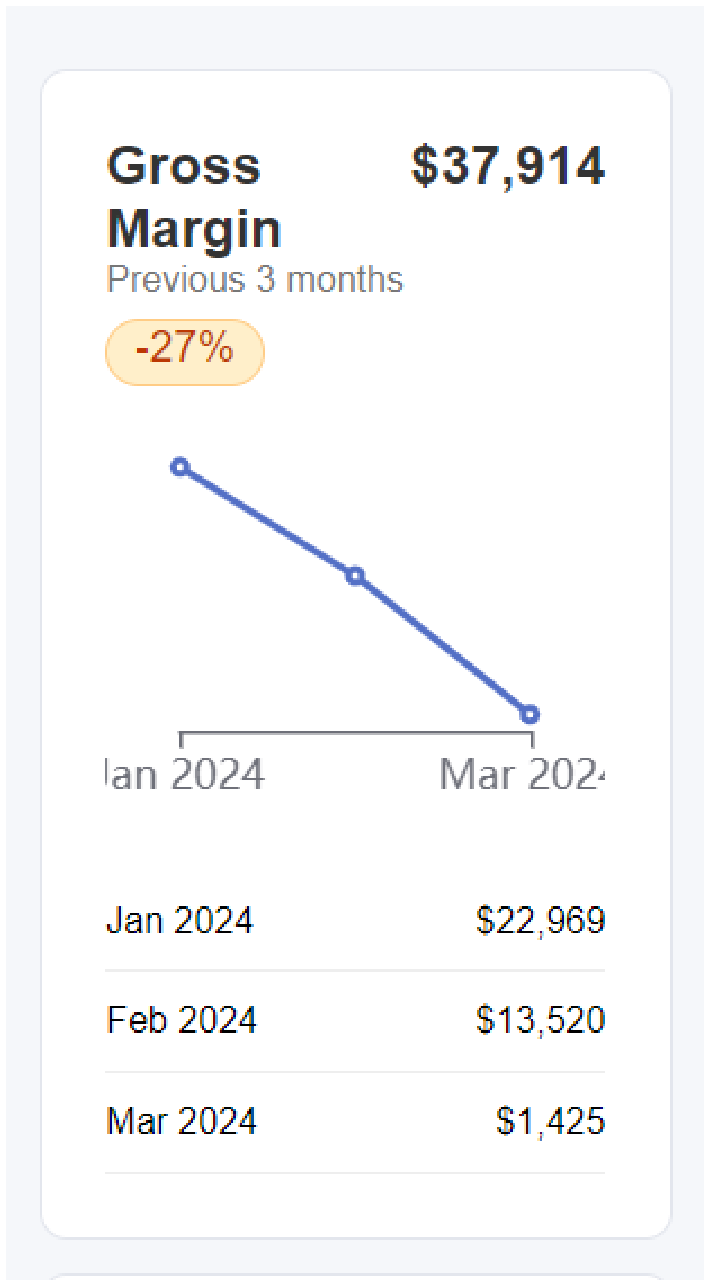
Gross Margin shows whether margin is up or down over the last 3 months. The formula is total billed minus total payout. All load statuses are included except available and canceled. Data appears as both a graph and a list; hover the graph for details.
Open Loads
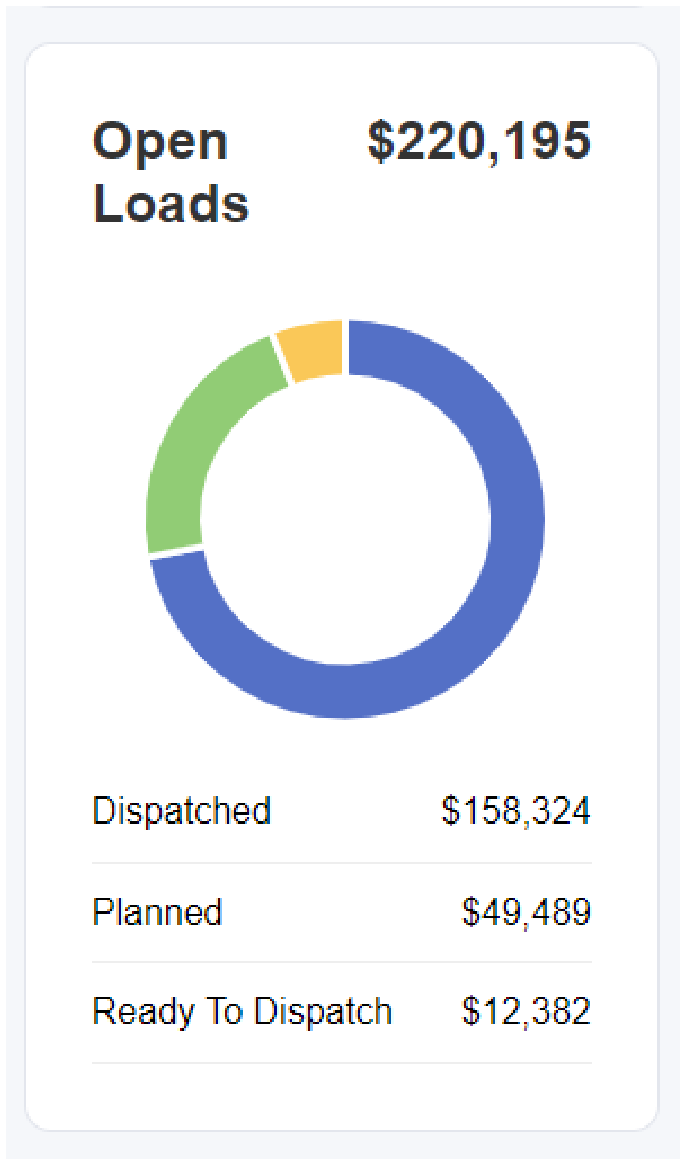
Open Loads includes shipments that are not yet delivered or closed out—available, planned, and in transit. Dollar amounts are total billing to customers (line haul, fuel surcharge, and other accessorials), rounded to the nearest dollar.
Customers
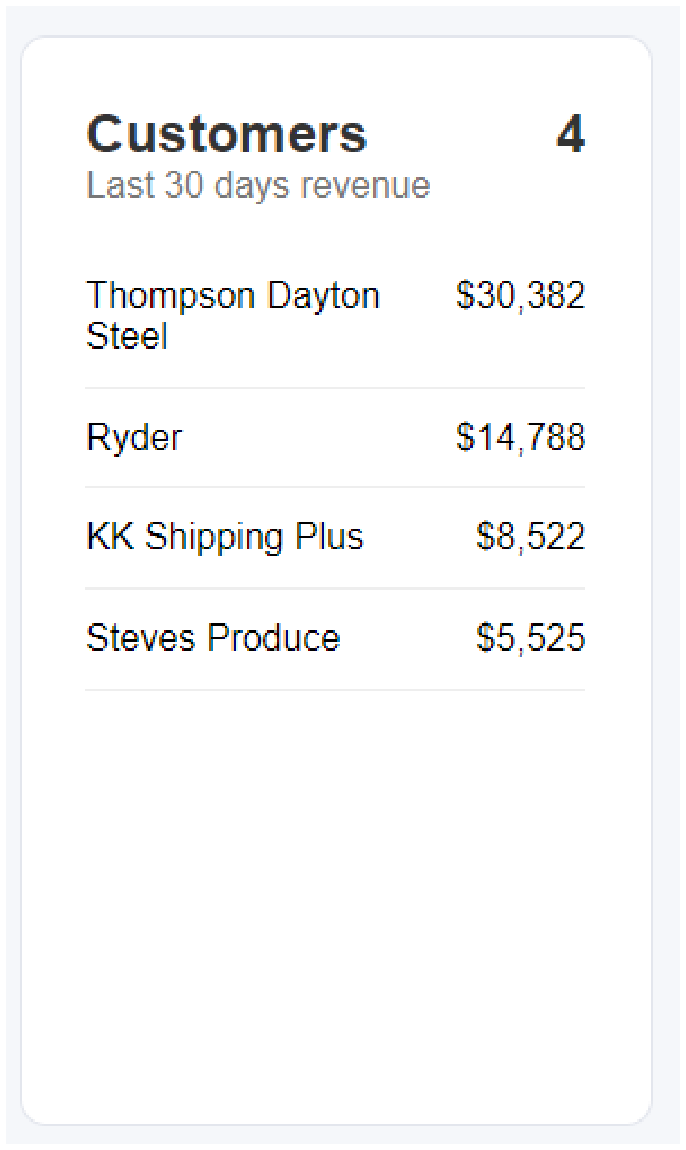
This list shows customers that account for your last 30 days of revenue, ranked by total billing amount (up to 10). Included statuses are available, planned, dispatched, and delivered; canceled is excluded. Totals round to the nearest dollar.
Terminal Leaderboard
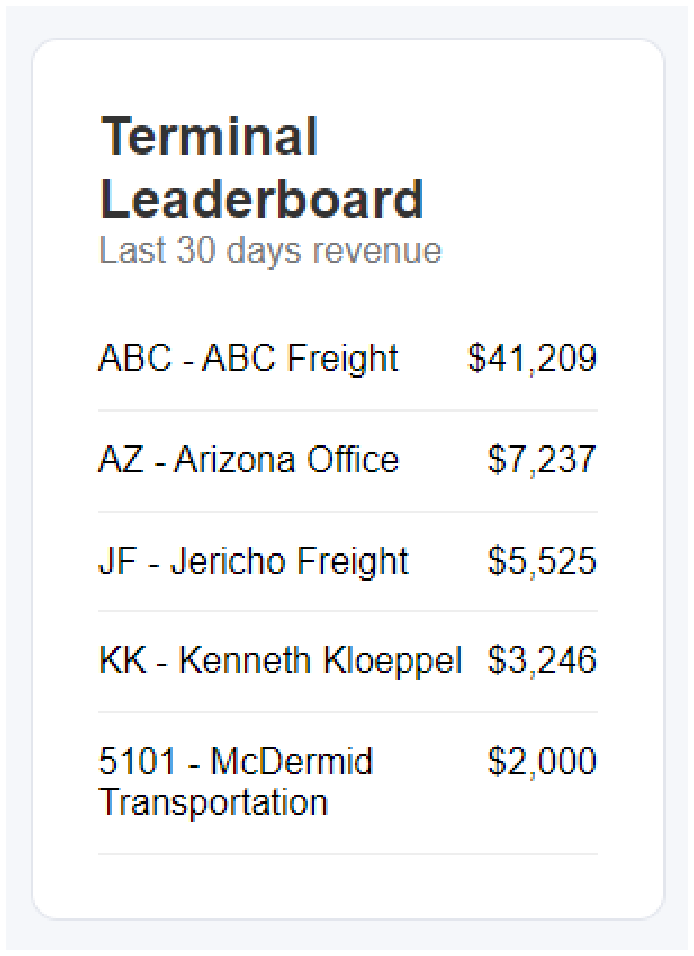
The terminal leaderboard lists your top-performing terminals or offices over the last 30 days by revenue (up to 10), in descending order. Totals round to the nearest dollar.
Sales Rep Leaderboard
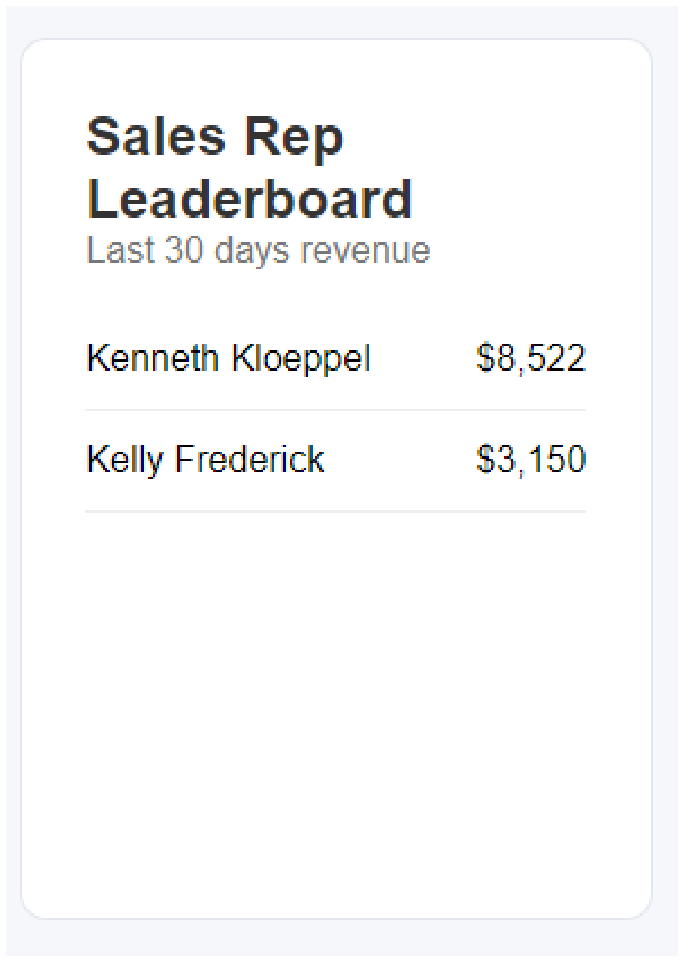
This board shows top sales reps for the last 30 days. Sales rep is the user assigned as sales representative on the customer record. Amounts are total billing on loads with available, planned, dispatched, or delivered status (canceled excluded). Up to 10 results appear, sorted by revenue descending, rounded to the nearest dollar.
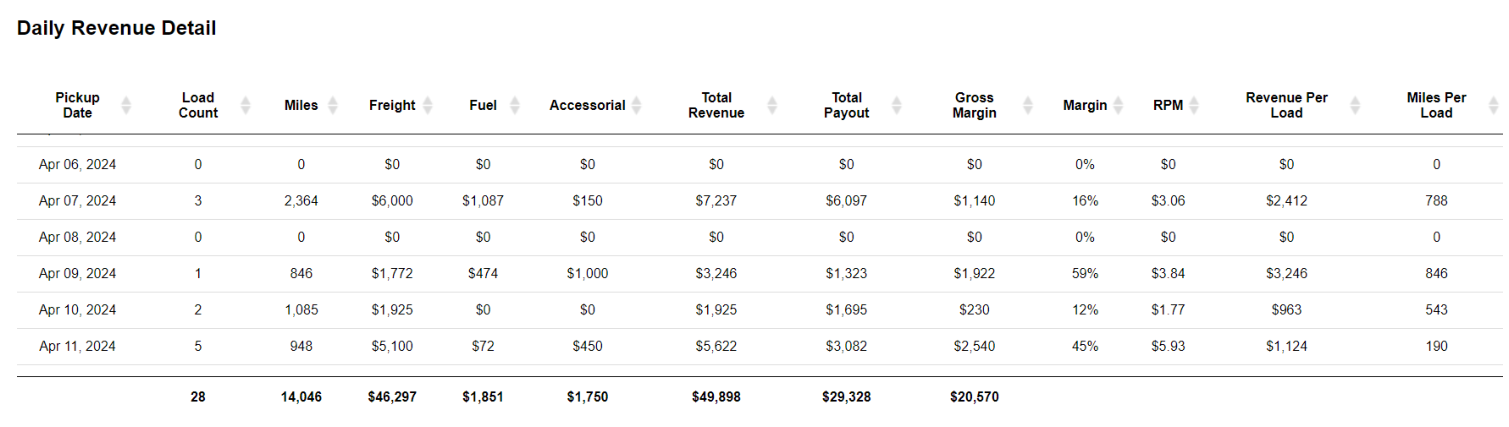
Daily Revenue Detail
At the bottom of the dashboard, a grid breaks down daily revenue in detail. Values shown are average amounts for each day.
Questions about the Executive Dashboard? Email support@transportpro.net.